01
Market analysis
Your audience, what people search, what is working on social and how much the competition advertises, crossed with prices, rates, weather and the calendar.
Orian AI · market intelligence
Orian reads public data and social media to show your audience, your competition and what is working in your niche. It forecasts the week and tests every piece of content before it goes live. You get the report every Monday.
01 / 05
The Orian Matrix collects what is public: statistics, prices, central bank series, searches, social video and posts, and the active ads in each niche. Open global sources such as the World Bank give it the big picture.
02 / 05
Country by country, every data point lands where it belongs. Where it simulates audiences, the Matrix uses statistical people built from census data, never a file on a real person.
03 / 05
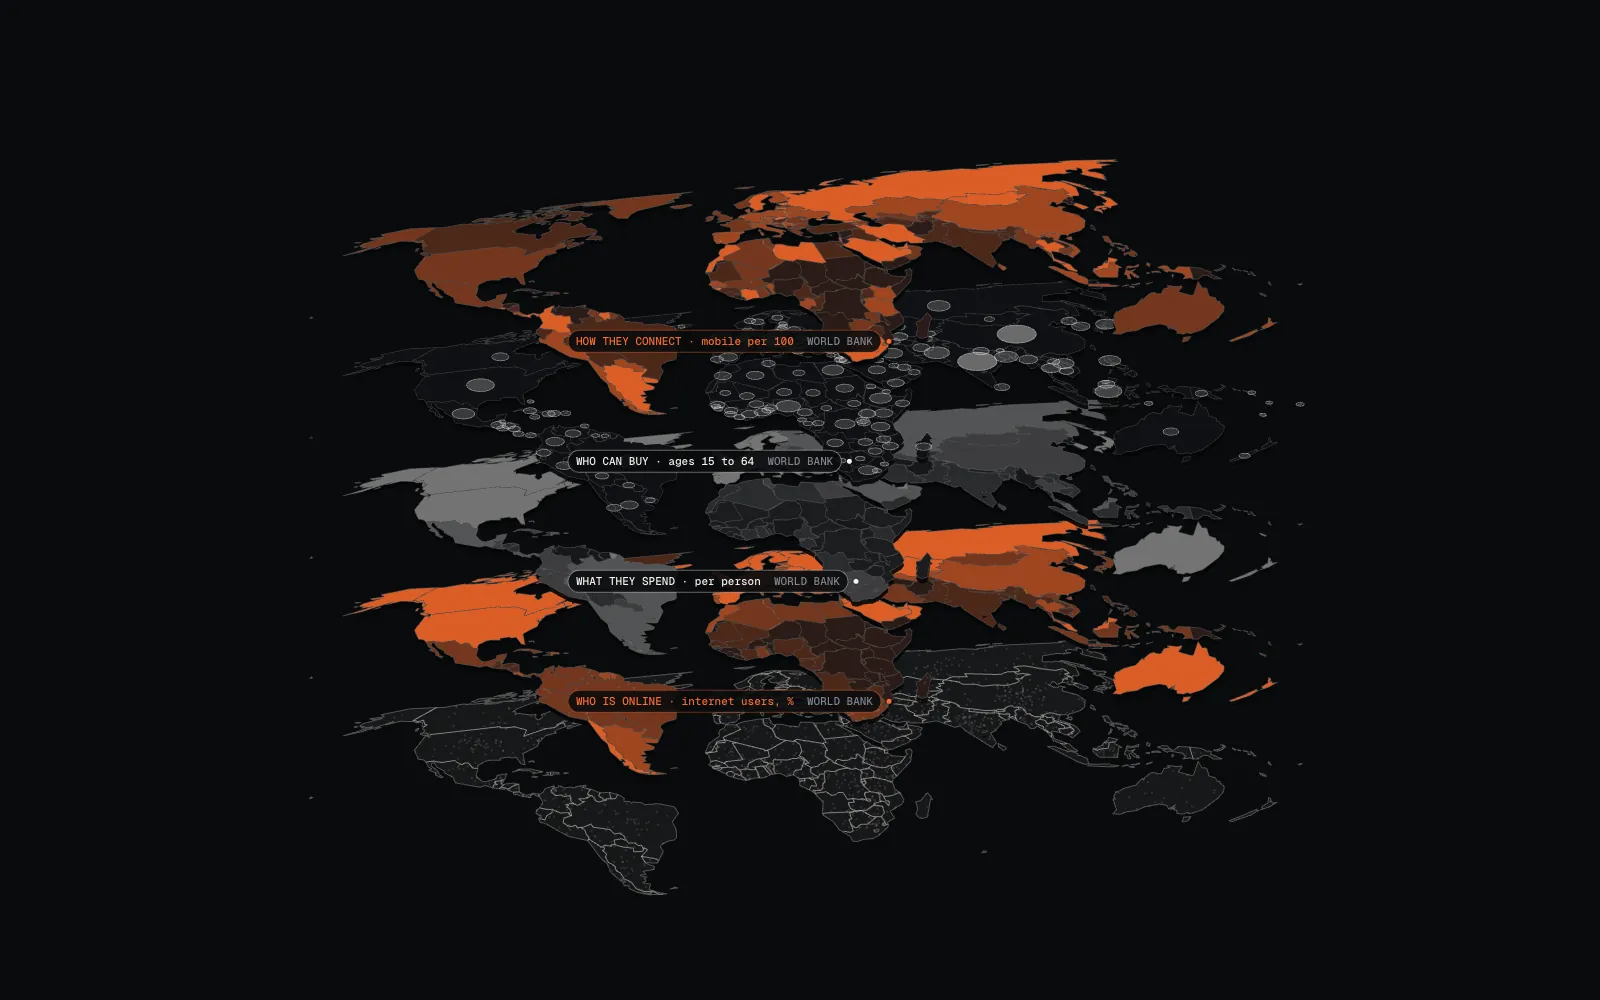
Who is online, how much they spend, how many can buy and how they connect, on the same map.
04 / 05
Post, image, script, video or ad: before it goes live, the content is read on 5 measures, from attention to action, and tested with the niche's simulated audience. Here, a personal finance Reel.
A map of 5 calculated measures. Not a brain scan, not eye tracking.
05 / 05
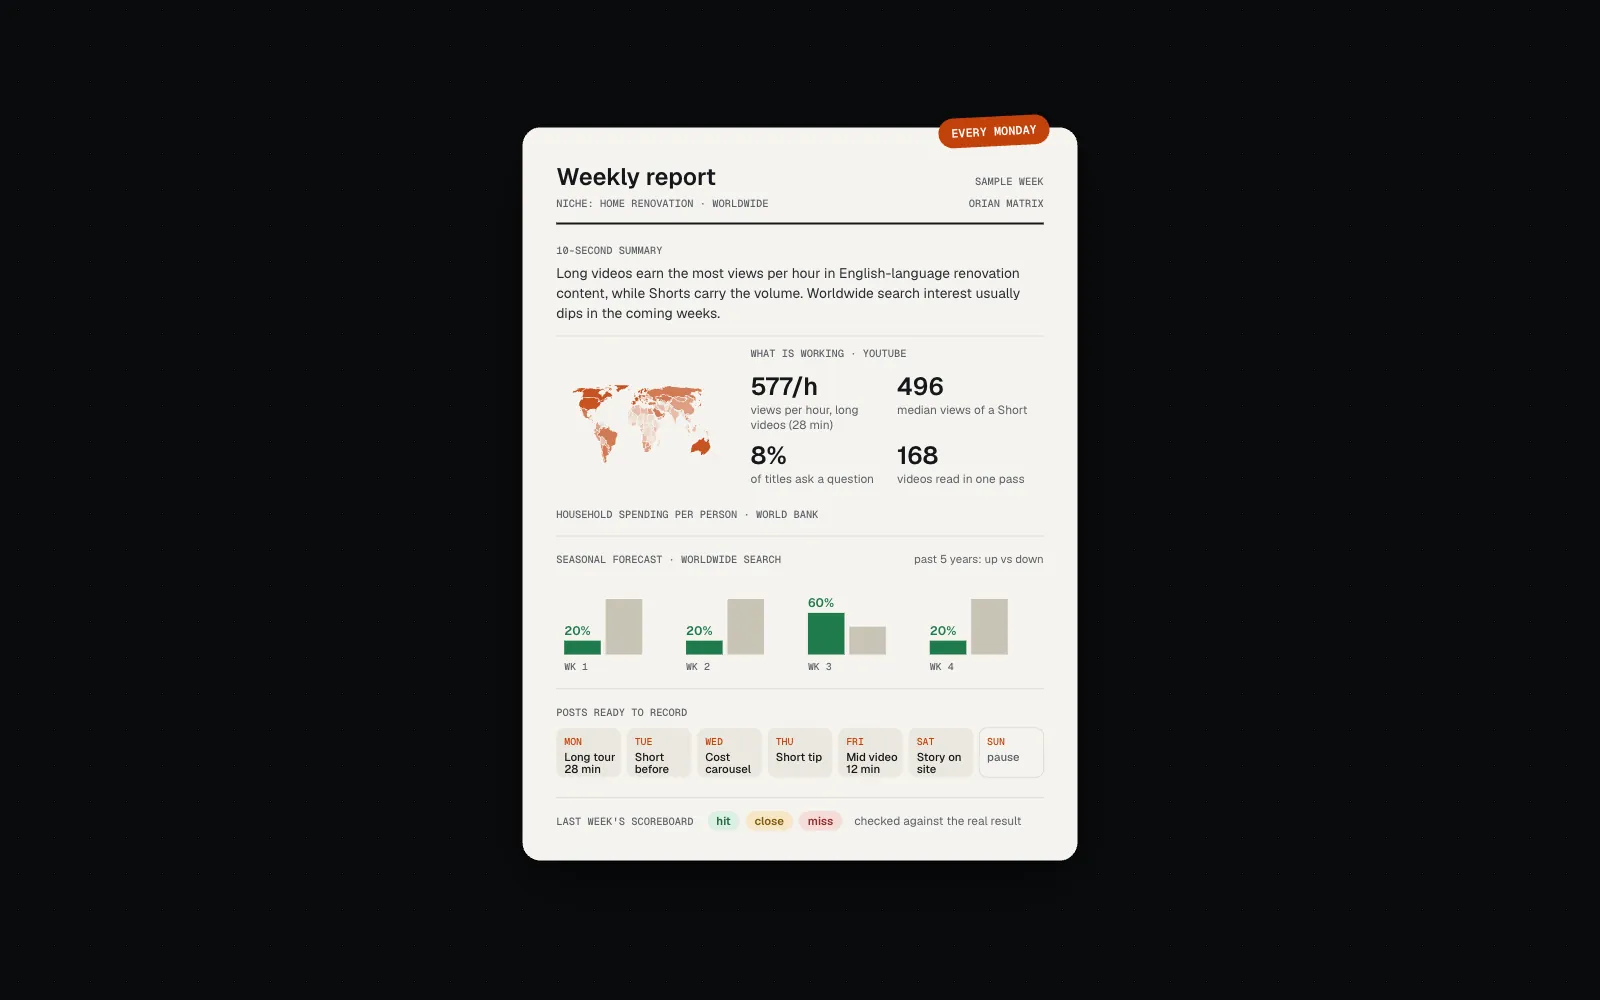
Every Monday, in your inbox, a report you can use the same day. No login, no dashboard. Inside:
Orian AI
Orian AI · market intelligence
Orian reads public data and social media to show your audience and your competition, forecasts the week and tests every piece of content before it goes live. You get the report every Monday.

What Orian does
01
Your audience, what people search, what is working on social and how much the competition advertises, crossed with prices, rates, weather and the calendar.
02
What is likely to rise and fall in your niche over the coming days, with the odds on each side and the reason why. Every forecast is checked against the real result.
03
A simulated population built from census data shows how many people are in your target, their purchase intent and how each group tends to react.
04
Posts, carousels, images, scripts, videos and ads go through 5 measures and come back with what to keep, cut or rewrite.
How it works
The Matrix collects open sources: statistics offices, central banks, prices, weather alerts, Google Trends, YouTube, Instagram and the Meta Ad Library, always through public search. Every number keeps its source and date.
The data feeds a simulated population built from census data. That is where the week gets forecast and content gets tested before it exists.
Every forecast is checked against the real result. Misses stay on the scoreboard and correct the next calculation.
Every block in the report says whether it is a fact, a forecast or a simulation. You always know what was measured and what was calculated.
What you get
No login and no dashboard to learn. You get the reading done and the week's strategy.
Weekly report
Niche: home renovation · worldwide
Sample week
10-second summary FactForecast
In English-language renovation content, long videos earn the most views per hour while Shorts carry the volume. Worldwide search interest usually dips over the next weeks: in the past five years it rose in only one of them. A week to build a library, not to chase reach.
Seasonal forecast: worldwide search interest Forecast
| Week | Direction | Past 5 years |
|---|---|---|
| 1 | ↓ Usually down | up in 1 of 5 |
| 2 | ↓ Usually down | up in 1 of 5 |
| 3 | ↑ Leans up | up in 3 of 5 |
| 4 | ↓ Usually down | up in 1 of 5 |
Market Fact
Household spending per person goes from US$ 195 to US$ 46,041 across the 153 countries with data, with US$ 4,026 in the median country: the same video meets very different budgets.
Posts ready to record
Scoreboard
The following Monday, every line is checked against the real result: hit close or miss.
Sources: YouTube public search in English (one reading), Google Trends worldwide (5 years, weekly) and the World Bank.
Content testing
Posts, images, scripts, videos and ads. Content comes back in minutes with five calculated measures, the niche audience's simulated reaction and a suggested fix.
For video and images, the Matrix shows where the eye tends to go in the first 3 seconds and a heat map of the image. It is a calculation on the content, not eye tracking of a real person. When the post goes live, the real result enters the scoreboard and calibrates the next reading.
Attention
A question as the hook. In this niche, 13% of titles ask a question and 28% start from “how”.
Keep · test a “how” version
Comprehension
Jargon (“debt-to-income ratio”) in the first 2 seconds.
Rewrite · “how much of your pay is already spoken for”
Emotion
Fearful tone from start to finish, with no way out offered.
Adjust · close with one doable step
Trust
Cites central bank data. No promise of returns and no product recommendation.
Keep
Action
Two calls at the end: save and send to a friend.
Cut · keep a single call
Example in personal finance, with real hook shares from an English-language YouTube reading. The Matrix talks about the audience and the content, never about where to invest.
Real numbers
General and global numbers, the same for any niche.
Where we are
The Matrix reads a market at full depth only where local public data is rich enough to check its own forecasts against. Everywhere else it starts from open global sources and goes deeper one market at a time. Tell us your market and we will tell you, plainly, how deep we can read it today.
The Matrix crosses searches, prices, weather, the calendar, social media, ads and each client's simulated audience. These are real cases from the first companies Orian works with, described by type of business.
Freight marketplace
What we read
When fuel prices jump 8% or more, truck drivers search for loads more, 1.25 times on average, for 1 to 3 weeks (it happened in 3 of 4 increases). Companies hiring freight do not search more.
What changed in the strategy
In the proposed recalibration, fuel prices weigh only on drivers, and for up to 3 weeks. For companies hiring freight, fuel is not a hook.
Matrix event study: weekly fuel prices and Google Trends.
High-end homebuilder
What we read
In the simulated audience, the number one objection is trust in the builder (59%), ahead of price (46%). Across profiles in the niche, owners speaking on camera get about 6 times the engagement. And a post whose text does not match its photo stops making sense.
What changed in the strategy
A series with the person in charge of the build answering questions on camera went into the plan, and posts were remade so the text matches the photo.
Matrix audience simulation; public reading of profiles in the niche.
Moving company
What we read
Of 22 conversations an ad brought in, the simulation estimated that about 7 would be vague requests or cheap small jobs, not real moves. In testing, a carousel with real photos reached 3.81 conversations per thousand, against 2.44 for an illustrated one.
What changed in the strategy
The ad is now judged by conversations that become moves, checked one by one. In the schedule, the real-photo carousel moved ahead of the illustrated piece.
Matrix audience lab; Meta ads.
Fashion app
What we read
The Reel with a story, a “no buy month” challenge, reached 1.8 times the profile's average Reel. The ones built on a standalone quote stayed near or below average.
What changed in the strategy
The story became a planned series: the challenge countdown continues day by day, in the same format that worked.
The profile's Instagram, Reel plays against its own baseline.
Rental real estate
What we read
After a major flood, searches for apartments to rent reached 1.8 times normal in week two and stayed above normal for 7 weeks. Searches for moving barely changed, with a small peak only in week five.
What changed in the strategy
After a weather event, expect weeks of rental demand, not a spike in moves. The weight of weather in the forecast is under review: more on rentals, less and later on moves.
Google Trends; a rental price index.
The Matrix labels what is data, what is reference and what is still a hypothesis. Every forecast ships with a date to be checked, and where it misses, the scoreboard shows it.
Matrix Fidelity Index.
Privacy
Statistics offices, central banks, searches, public posts and public ads read together, never profile by profile.
The people in the Matrix are statistics built from census data. They have no name, no ID number and no social media account.
Orian does not buy contact lists or match personal data. Competition is read in aggregate, without exposing brands. This site uses no cookies and no trackers.
Our work follows the data protection laws that apply to it. What a client sends us serves only that client's report.
Contact
Tell us your niche and your region. The first conversation is to see whether the Matrix already reads what you need.